
This article hopes to provide meaningful Tips and Tricks for the business analytics service that Microsoft offers called Power BI. Power BI is available to use within an Office 365 subscription. The tips and tricks have been developed based on a project where no direct access to the pro service is possible. The reports for this project are uploaded to the pro service as files and refreshed according to a schedule.
Tips & Tricks
Templates / Themes
Create slick reports that are used across an organisation to enhance the reports that are produced. To do so a consistent format, utilisation of the corporate colour pallet and pre-loaded common data can be used.
Power BI Themes
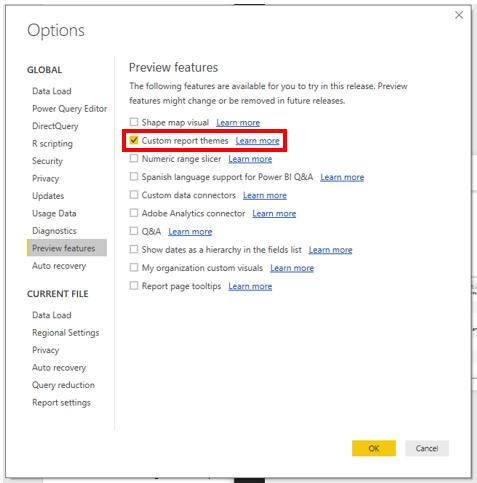
Power BI allows the creation of a custom theme, this custom theme is built using JavaScript Object Notation (JSON). Fortunately, the community have a pretty good online tool that builds a theme.
To import a theme, there is a setting in the options that should be checked.
Templates
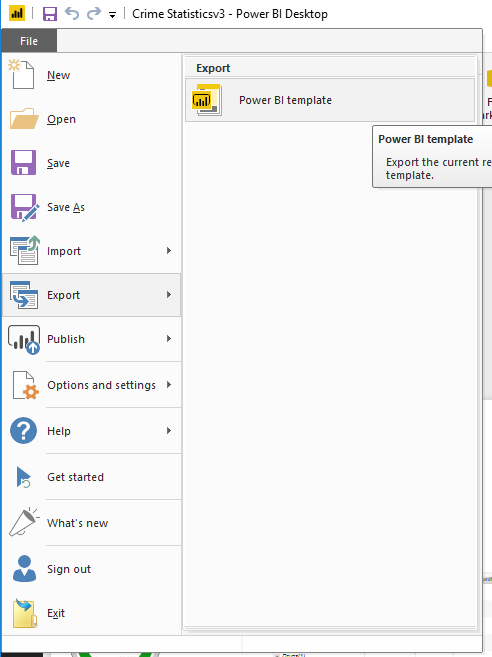
Create a template that contains boilerplate content and common data to reduce development time, increase consistency and produce a professional look and feel.
To save as a template – File > Export
Top Tip: Utilise parameters and other useful power BI features in the template? Anything, that gets done a number of times can be added to the template.
Structuring Queries
When starting a report, try and structure the report queries to a relative granular style.
Groups
To make the Queries more manageable utilise groups. Groups can help with maintenance and also if used along with a template, result in a consistent approach to producing Power BI reports.
A consistent approach helps other Power BI resources understand what is being done and reduces the time it takes new resources to get up to speed with the Power BI reports that are produced.

Parameterise Connections
Use parameters to store any connection strings to data sources. Doing so means not having to update multiple connections each time a report starts looking at a different data source.


Measure Tables
Measures allow calculations to be applied to data that is brought into the report. Measures can be created as quick measures or a normal measure.
Keeping Power BI clean is a key way of keeping it maintainable, one way of doing this is to create an empty table to store measures in. This can be extended to create an empty query per database object that is connected to.
Example
You have three different views (view 1, view 2, view 3) and each view will have measures created against them, let’s say 10 measures per each view. That is 30 measures, and when they are embedded as part of the view fields it becomes a little messy to maintain.
Creating a table for each of these views called ‘Measures View 1’, ‘Measures View 2’ and ‘Measures View 3’ and creating all the measures for the relating view in the above table keeps the measures (calculations on the data) separate to the raw data itself.
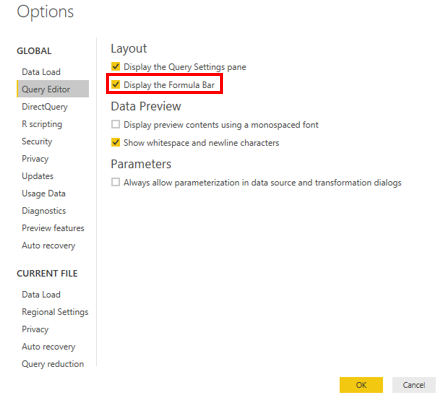
The formula Bar
Power BI uses several different languages due to the integration capabilities of the tool. Because of this, I find it very useful to always display the formula bar. The formula bar can be made visible by File > Options and settings > Options > Query Editor > Display Formula Bar
Publishing to the Pro Service -Default Page
If uploading PBIX files to the pro service, make sure that the file is saved on the page that should be visible when the report is opened from the pro service. If the report is saved on the incorrect page and uploaded to the pro service, the incorrect page will be displayed when the report is opened from the pro service.
Documentation – Utilise the Data Model Schema file
Now, everybody knows that documentation is by far the worse part of any technical solution/system. Like who ‘really’ wants to document what they have done. However, after digging about in the file structure of a pbix file a file exists in JavaScript Object Notation (JSON) format that contains a complete Data Model.
This is useful, as Power BI doesn’t have a way of capturing any updates that are made to a report. However, this file – called DataModelSchema, was extracted a complete model of the data is available. This includes all measures and the last updated date, created date etc…
The process of obtaining this file is a little convoluted but it does result in less documentation – as there isn’t a need to document is such a low level.
- Save the current report as a power bi template (pbit)
- Navigate to this file and change the file type to a .zip folder.
- Unzip this folder
- Find the ‘DataModelSchema’ Folder and open it in a text editor (notepad works fine for this)
- Sometimes it is easier to drag the file into an empty notepad file
- Save the file in notepad as .JSON or paste it into an online viewer to see the benefits of this file
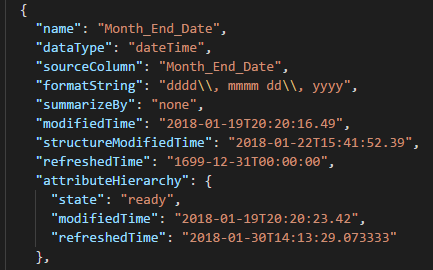
- Example of a single measure from the Data Model Schema file.
- This file saved in a source control system such as GIT or TFS will also provide file deltas.
Useful Links
Optimise reports: https://docs.microsoft.com/en-us/power-bi/power-bi-reports-performance
QR Code for a Report: https://docs.microsoft.com/en-us/power-bi/service-create-qr-code-for-report
Mobile Phone Optimisation: https://docs.microsoft.com/en-us/power-bi/desktop-create-phone-report
URL Filters: https://docs.microsoft.com/en-us/power-bi/service-url-filters
Power BI Theme Generator: https://powerbi.tips/tools/report-theme-generator-v3/
Thanks to Kevin McKillop for the input into this article.
Please note that anything used in this article is done so at your own risk. Content may change due to the ever-evolving nature of O365 Products / Services.
